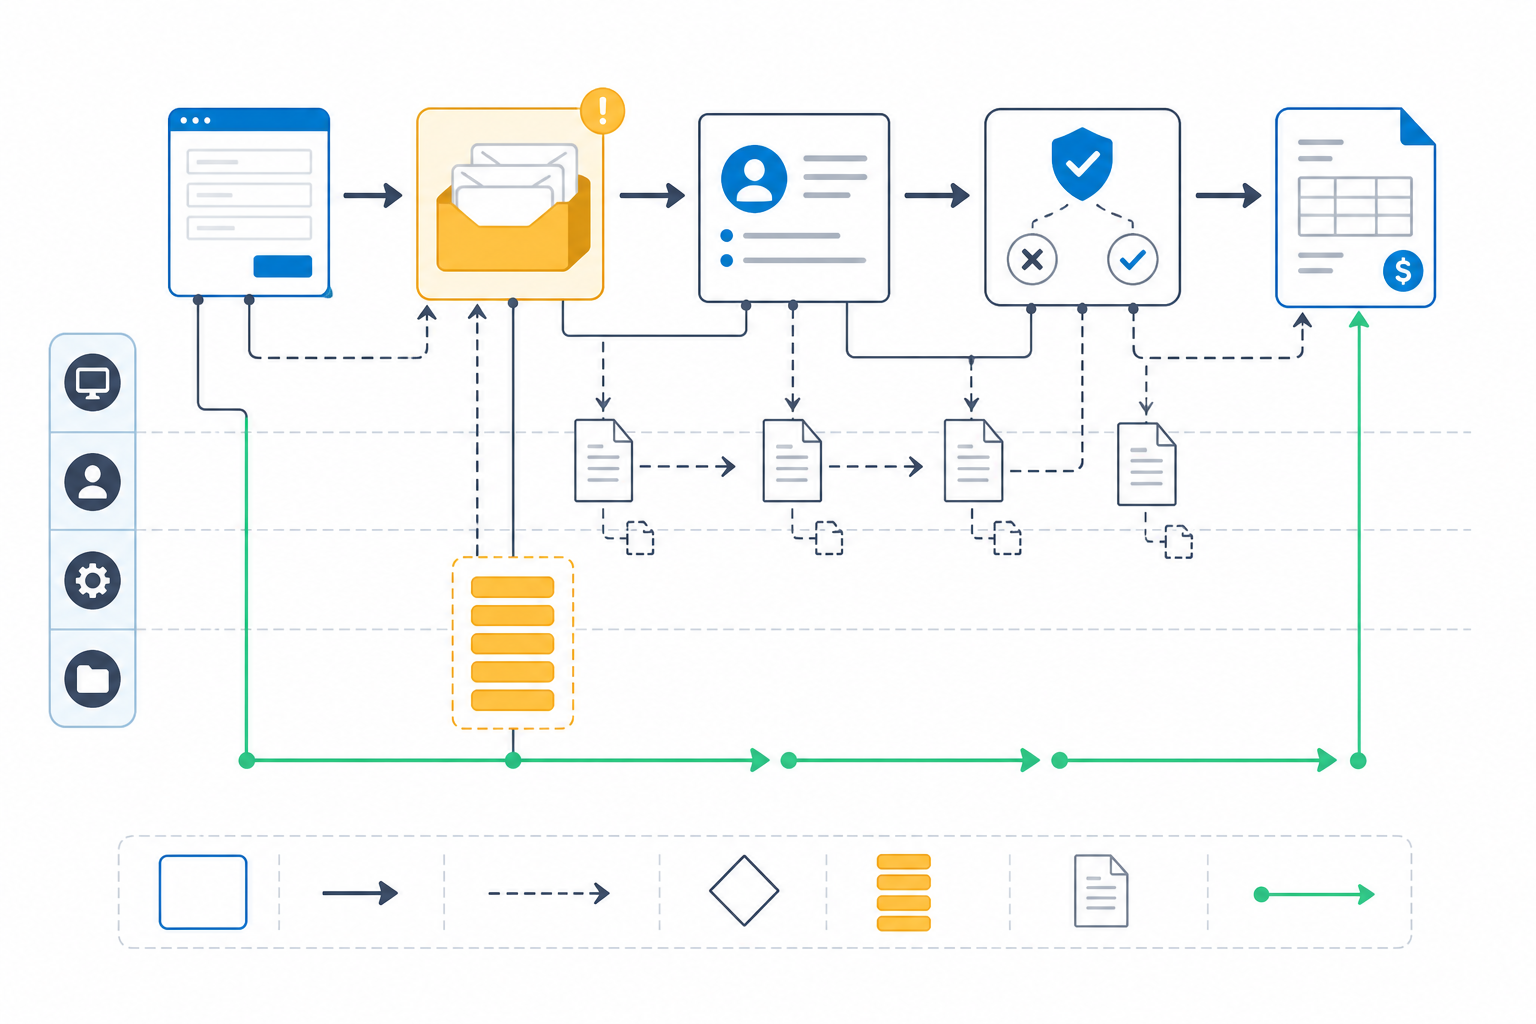
Business process mapping is how you see the real path of a job — not the version in a handbook. It shows each step, who owns it, where work waits, and where a person has to decide. Until that picture exists, “we should automate this” is a guess.
For a growing service business, the usual map is not a map at all. It lives in one person’s head, a Slack thread, and a spreadsheet that only makes sense on Friday. The first useful map is a current-state picture of one painful workflow. It is not a 40-page operating system, and it is not a software purchase.
What business process mapping actually is
IBM describes process mapping as a visual method for understanding a workflow and finding where it can improve. A map names the start, the end, the steps in between, the handoffs, and the exceptions. It is broader than a flowchart. A flowchart is one format. Swimlanes, SIPOC charts, and BPMN diagrams are others.
The job of the map is communication. Someone who does not live in the process should be able to follow it and ask a sharp question: why does this wait here, who owns that decision, and what happens when the input is wrong?
Why growing teams need a map before they buy tools
Manual work rarely fails in one dramatic moment. It fails in small, repeated places: a form that gets retyped into a CRM, an approval that sits in an inbox, a status that nobody can find. Those delays feel like a staffing problem. They are often a visibility problem.
A map makes the cost visible. You can count the copy-paste steps. You can see three people touching the same record. You can mark the places a customer waits because two tools do not talk. That is the input GPA needs in an assessment: the real path, not the hoped-for one.
Skip the map and two things happen. You automate a broken sequence and make the mess faster. Or you buy a platform and then spend weeks reverse-engineering the work the software was supposed to run.
Which map to use (and which to skip)
Use the simplest picture that answers the question you have. Extra notation is not extra rigor.
Basic flowchart
Start here when one team owns a linear job: intake, a few checks, a result. Ovals for start and end, rectangles for tasks, diamonds for decisions, arrows for flow. This is enough for invoice intake, a lead handoff, or a content-publish checklist.
Swimlane (cross-functional) map
Use lanes when work crosses sales, ops, finance, or a client. Each lane is a role or system. Handoffs show up as the flow jumping lanes. If your pain is “we never know who has it,” this is the map.
SIPOC before the detail
SIPOC stands for suppliers, inputs, process, outputs, and customers. It is a scoping chart, not a step-by-step diagram. Use it when the team cannot even agree where the process starts. Then draw the flowchart.
BPMN — only when you need a shared language
Business Process Model and Notation (BPMN) is the formal standard for process diagrams. The Object Management Group maintains it so business and technical people can read the same picture, and so a diagram can later become software. That is useful when several systems and exception paths have to be unambiguous.
It is not required for a first map. A whiteboard flowchart that the people who do the work will correct is more valuable than a perfect BPMN file nobody maintains.
How to map one current-state process
Map how the work happens this week, not how it should happen after a reorg. IBM’s sequence is still the practical one: pick a process, bring the people who run it, outline the steps, draw it, then check it with the team.
- Pick one process with a clear start and end. “Operations” is not a process. “New client from signed proposal to first invoice” is. Choose something frequent, painful, and owned by people you can interview.
- Talk to the people who do the work. Watch one real instance if you can. Ask where they copy data, who they wait on, and what they do when the input is wrong. Official SOPs miss the side doors.
- List steps before you draw. Capture trigger, inputs, actions, decisions, tools, outputs, and the next owner. Do not polish yet. Missing steps are the point of this pass.
- Draw the current path, including the ugly branches. Show the happy path and the exceptions: missing PO, duplicate lead, client who replies in a personal inbox. If an exception happens every week, it is part of the process.
- Mark waits, handoffs, and rework. A delay symbol or a simple note is enough. Write the system next to the step (Gmail, HubSpot, QuickBooks, a shared drive). Rework loops — send back, fix, resubmit — are usually your first automation candidates, or your first process fixes.
- Walk the map with the team and freeze a version. If two people disagree, you found tribal knowledge. Resolve it on the page. Date the map. Name an owner. A map with no owner is a slide.
What a useful map makes obvious
You are looking for patterns, not pretty boxes:
- Ping-pong handoffs. The same record crosses two teams more than once for no added decision.
- Rekeyed fields. The same name, amount, or date is typed into a second system.
- Invisible queues. Work sits in an inbox, a personal spreadsheet, or a “waiting on them” folder with no SLA.
- One hero. A single person is the only one who knows the exception path. That is a risk, not a process.
- Tools that do not connect. A person is the integration. That may be automatable — or it may mean the process should change before anyone builds a workflow.
Write numbers on the map when you have them: volume per week, minutes per step, error rate, how long a typical case sits. Guessing is fine if you label it as a guess and replace it with a count later. GPA’s Task Automation ROI Calculator needs those hours and a loaded hourly rate. The map is how you know which hours you are counting.
Current state first, future state second
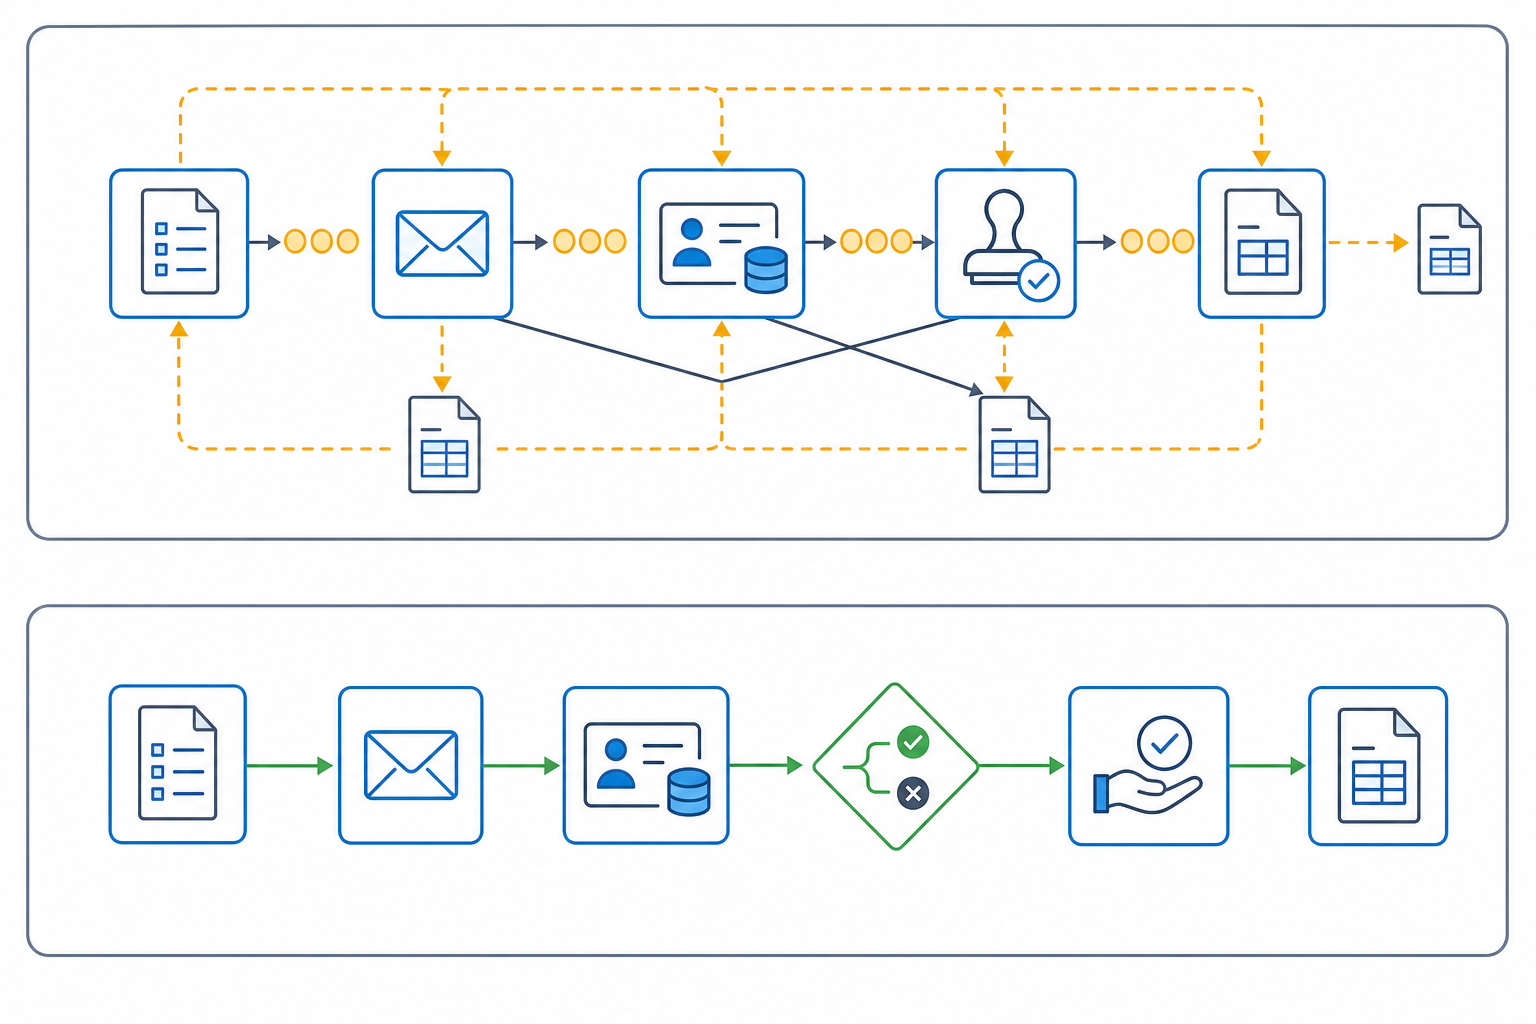
A future-state map is useful after the team agrees on the present. It should remove waits and rework, not add a new tool to every box. Decide which steps stay human: pricing exceptions, refunds, anything that changes a customer relationship. Then decide which remaining steps are rules-based enough to automate.
That split is the same test in GPA’s automation feasibility guide: is the work simple, frequent, connected to your existing tools, and valuable enough to build? A clean map makes those four checks faster. A missing map makes people argue about software.
What not to do
Do not map the entire company in one pass. One process, one owner, one review meeting. Do not start in a modeling tool if a whiteboard gets better corrections. Do not label a few rectangles “BPMN” — either you are using the standard, or you are drawing a flowchart, which is fine.
Do not automate from the future-state map until you have run the current process against it. If the future path assumes a field that nobody captures today, the workflow will stall on day one. And do not treat process-mapping software as the deliverable. The deliverable is a shared, dated picture of the work, plus a decision about what to fix or build next.
A sensible first mapping project
Pick a weekly workflow with a known trigger and a known finish line: lead to first meeting, invoice received to posted, new client to kickoff complete. Timebox the mapping to a few hours with the people who touch it. Leave the map in a place the team already works — a shared doc, a diagram in your project tool, even a photographed whiteboard with typed notes underneath.
Then choose one change. Remove a handoff, add a required field, or sketch a workflow that captures a file, writes the fields, and routes the exception. That is GPA’s Assess → Plan → Build sequence on a small scale: see the work, decide what is worth building on the tools you already use, then build it with an owner for the edge cases.
Business process mapping FAQs
What is the difference between process mapping and a flowchart?
Process mapping is the practice of documenting how work moves. A flowchart is one diagram type used to do that. Swimlanes, SIPOC charts, value-stream maps, and BPMN diagrams are other types. Most SMB teams should start with a flowchart or a swimlane map.
Do I need BPMN or process mapping software?
Not for the first map. BPMN helps when you need a precise, shared notation — especially if the diagram will later drive automation. Software helps when several people will edit the same diagram. Neither replaces interviewing the people who do the work.
Should we map before we automate?
Yes, at least for the one workflow you want to change. Automation copies the path you give it. If that path includes hidden waits and tribal exceptions, you will scale those too. Map the current state, fix what is obviously broken, then automate the repeatable remainder.
How detailed should the first map be?
Detailed enough that a new hire could follow a real case, including the common exceptions. Not so detailed that you are writing field-by-field work instructions for every screen. If a subprocess needs that level, give it its own page and link it.
Map one process, then test whether it is worth building
If a workflow is running on memory and follow-up pings, bring that one process to a working session. GPA will walk the current path, mark what should stay human, and tell you whether the automation is worth building before you commit to a larger project. Start with the free Automation ROI Assessment, or book a working session.